Video Tutorial
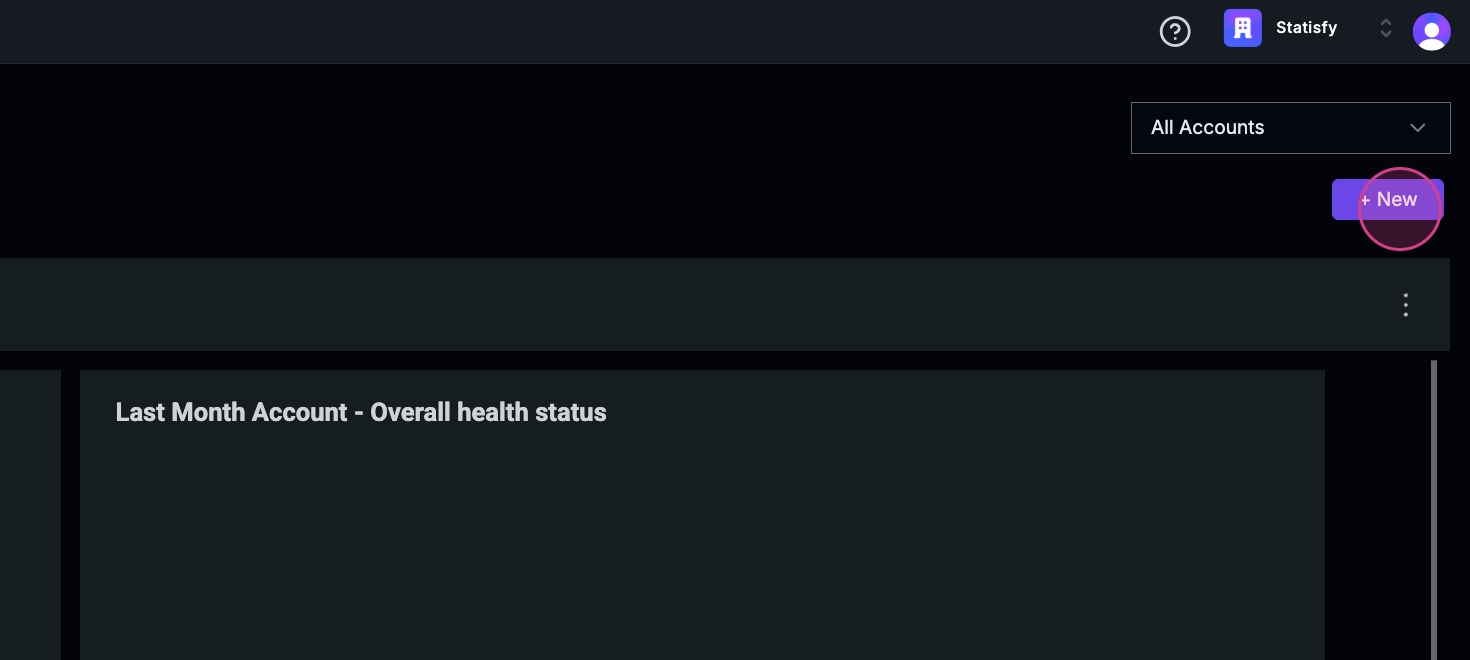
In this article, you’ll learn how to combine two data sources and generate a survey report. Step 1: Navigate to the reports page. Step 2: Click on New to create a new visualization.
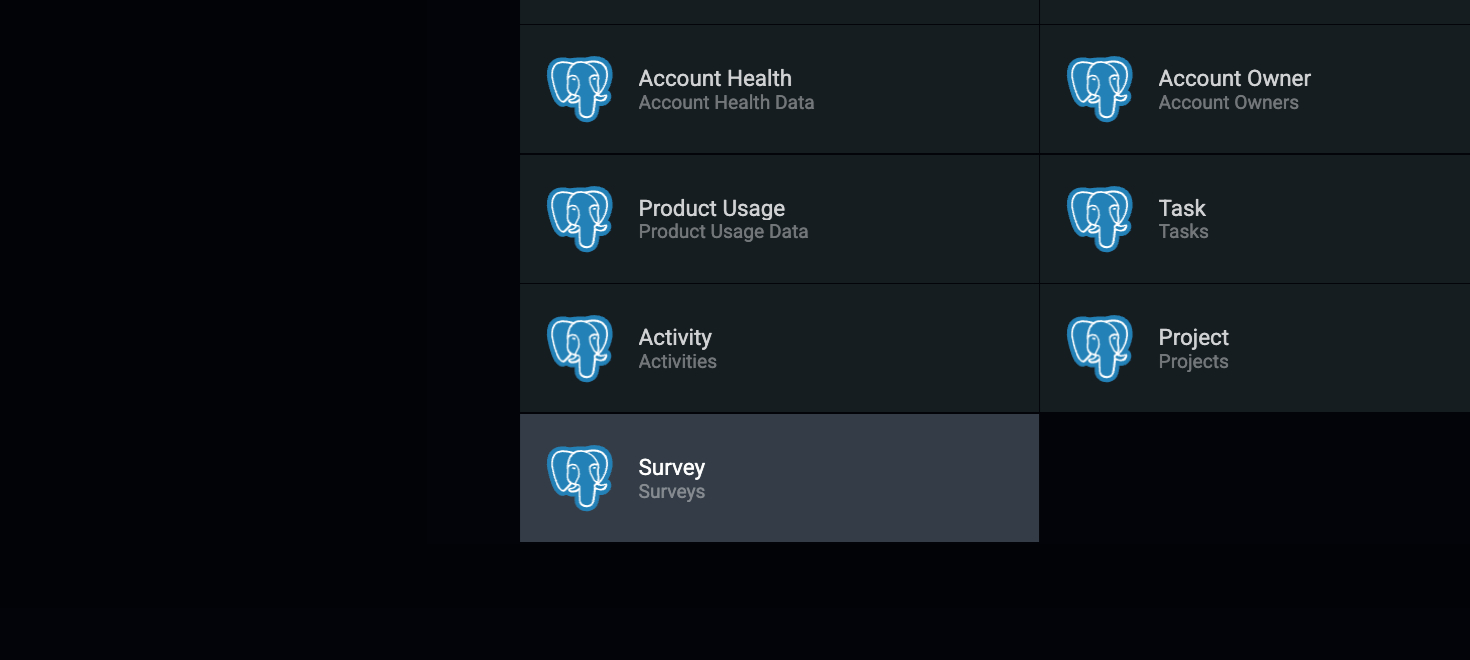
 Step 3: Since our focus is on the survey, click on Survey.
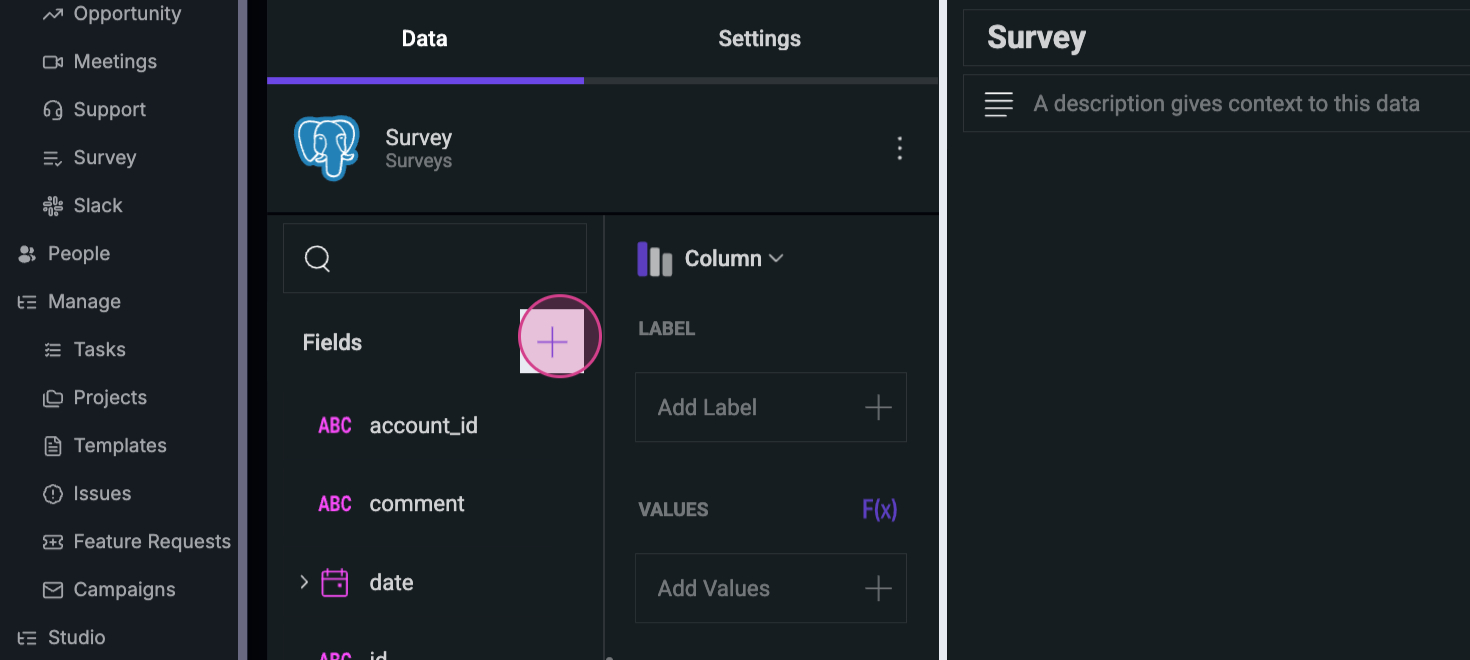
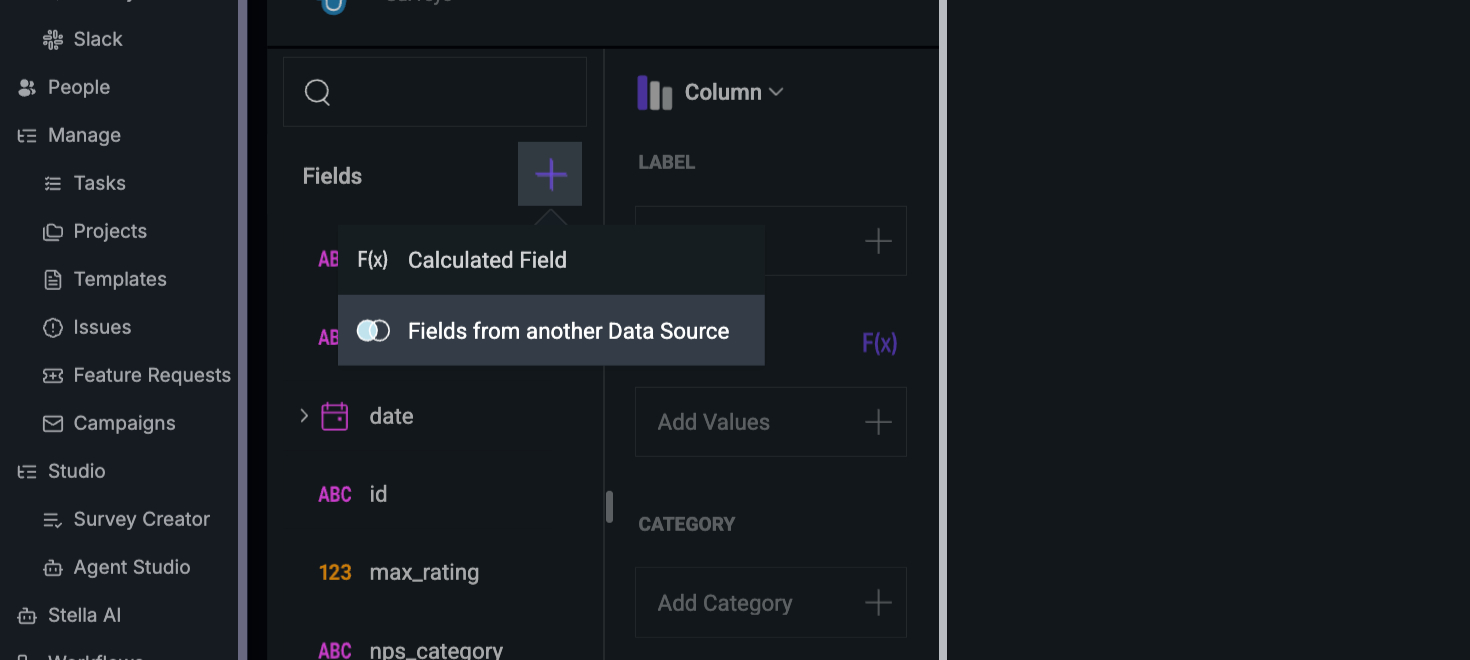
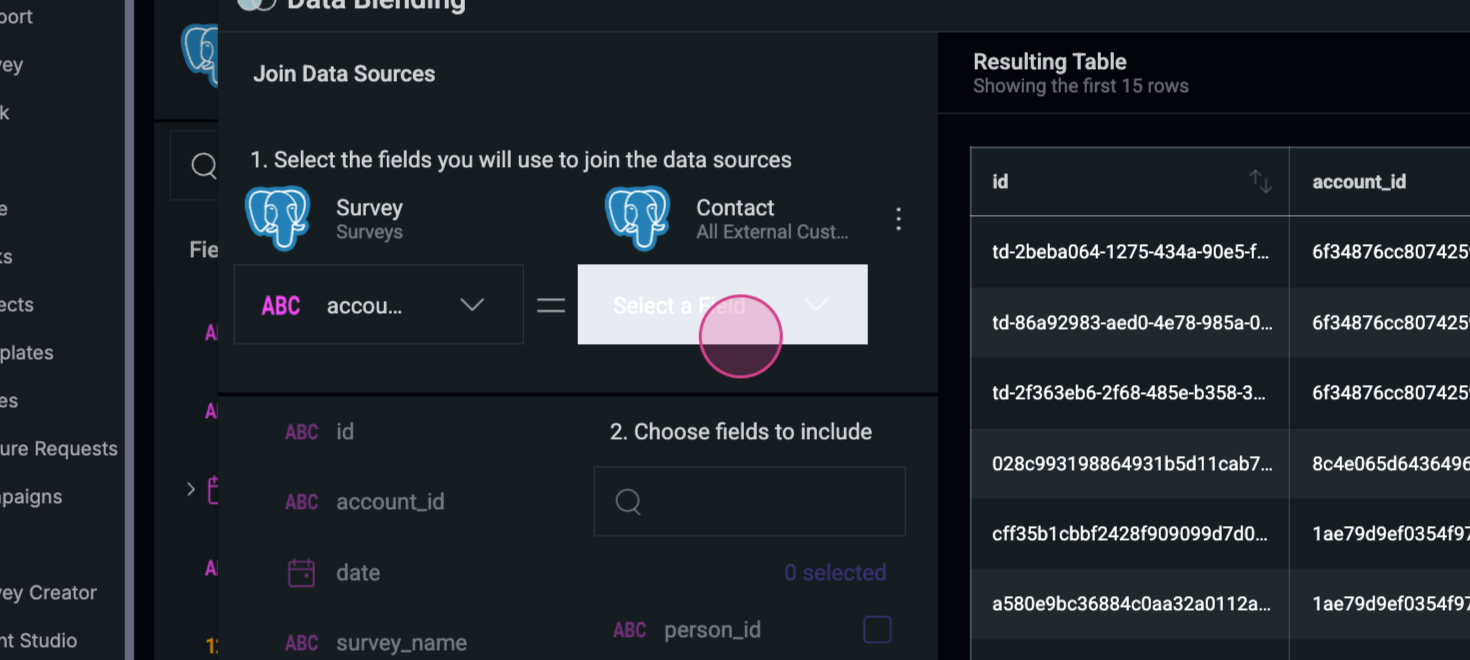
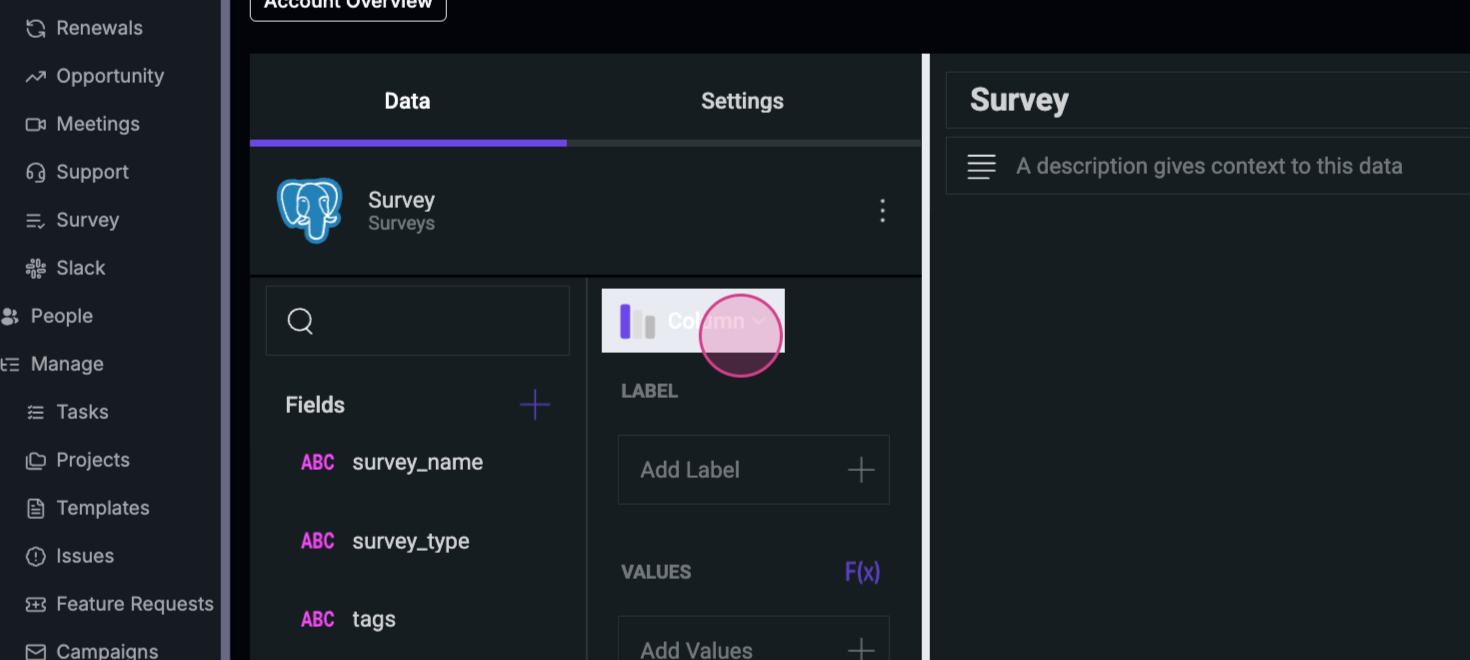
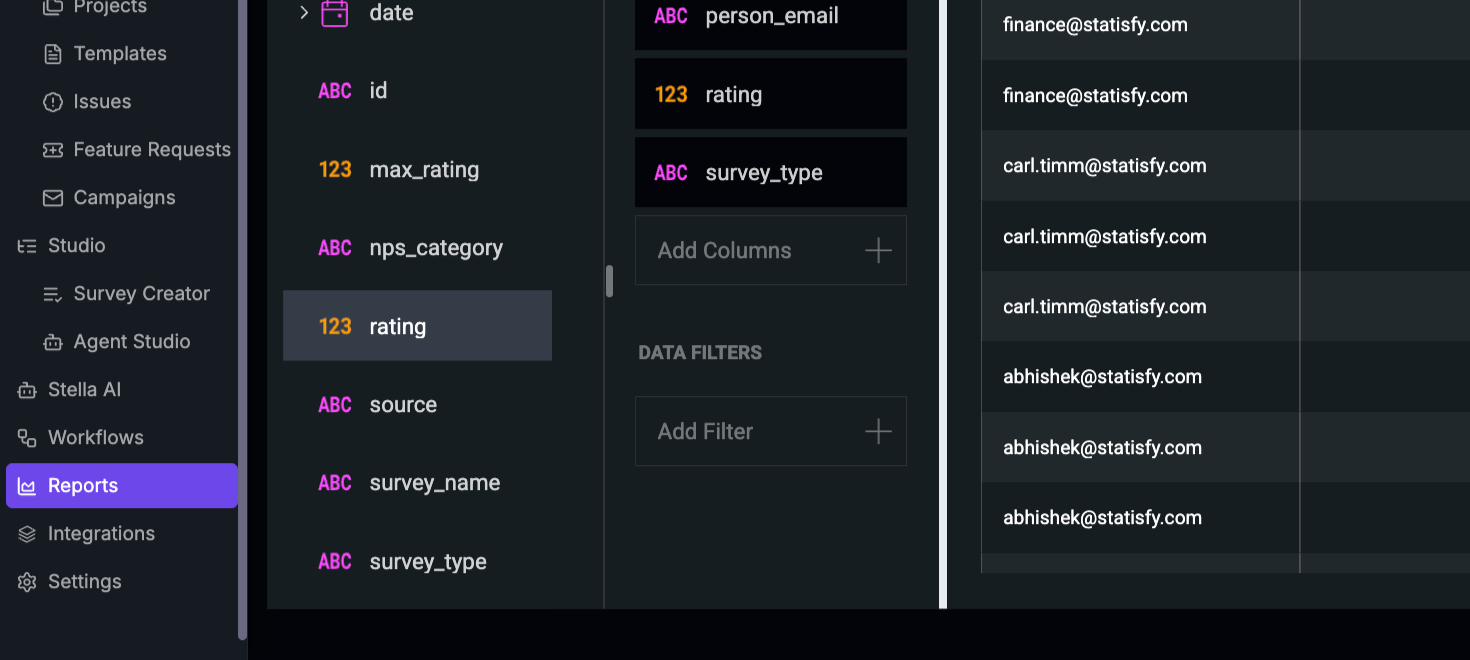
 Here, you’ll see the fields related to the survey. These include the survey name, type, tags, maximum rating, and account ID. However, if you need specific person-related information, it’s not available in the survey data source.
Step 4: To add this, click on the Plus button and select Fields from another data source.
Here, you’ll see the fields related to the survey. These include the survey name, type, tags, maximum rating, and account ID. However, if you need specific person-related information, it’s not available in the survey data source.
Step 4: To add this, click on the Plus button and select Fields from another data source.
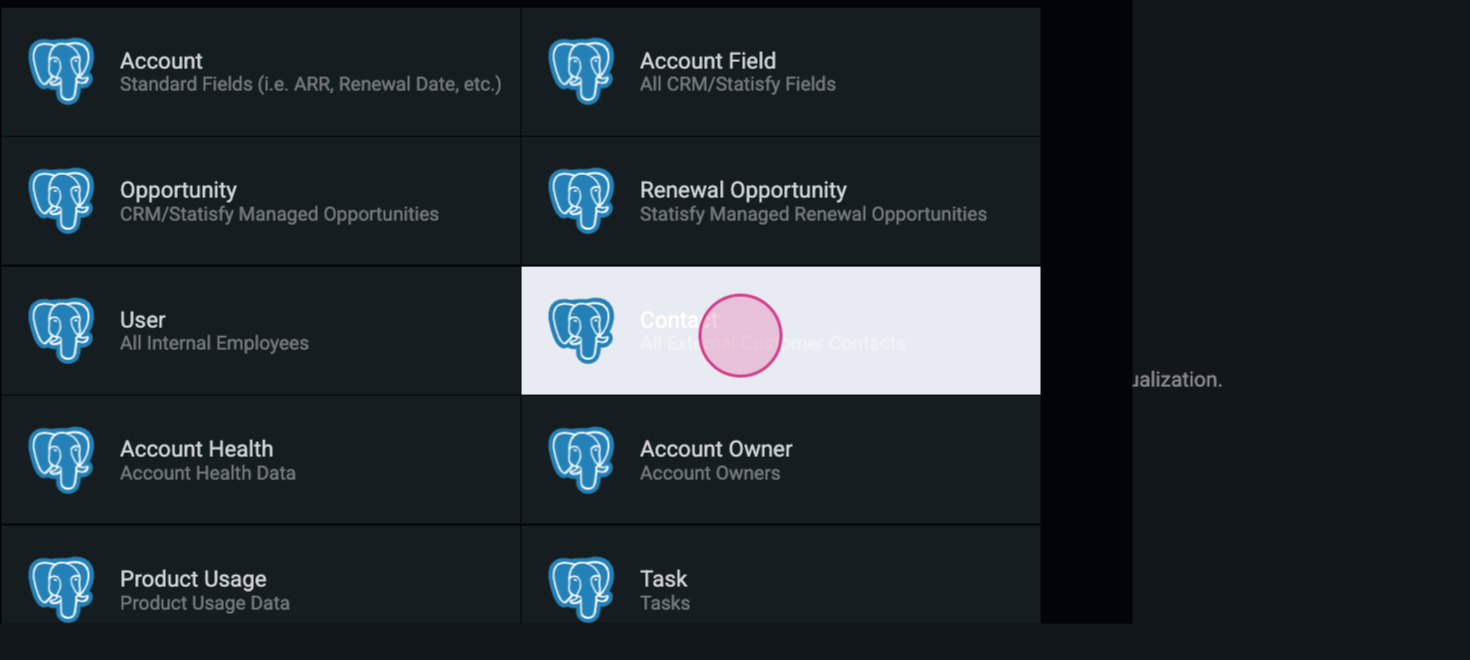
 Step 5: Click on Contact to access the external customer contacts.
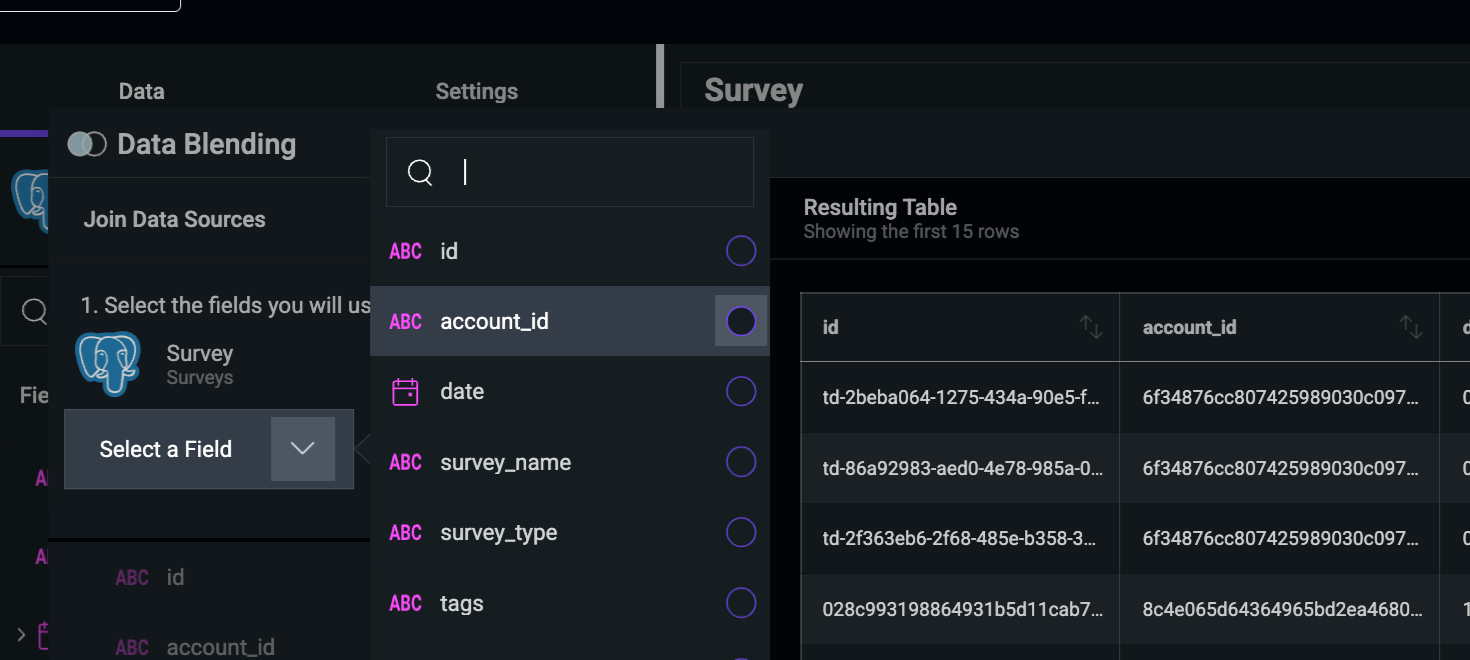
 Remember, the Account ID is the unique identifier in most data sources.
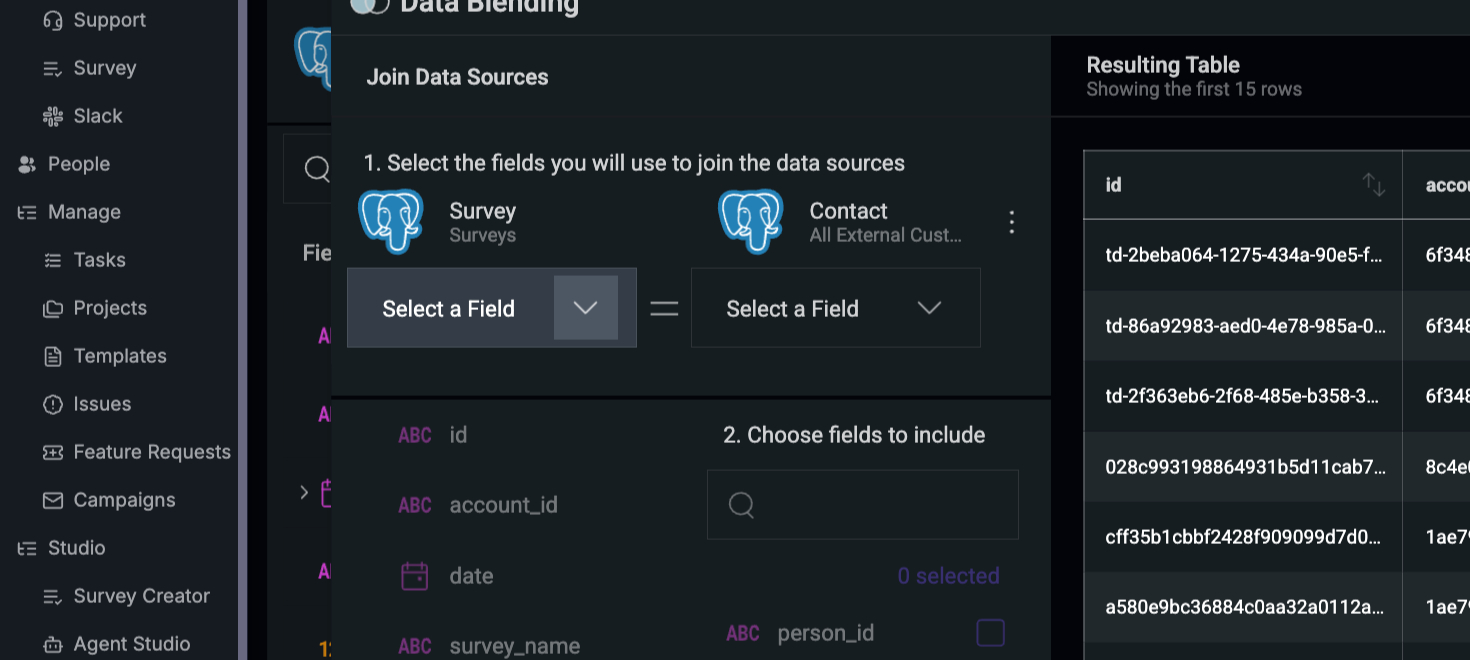
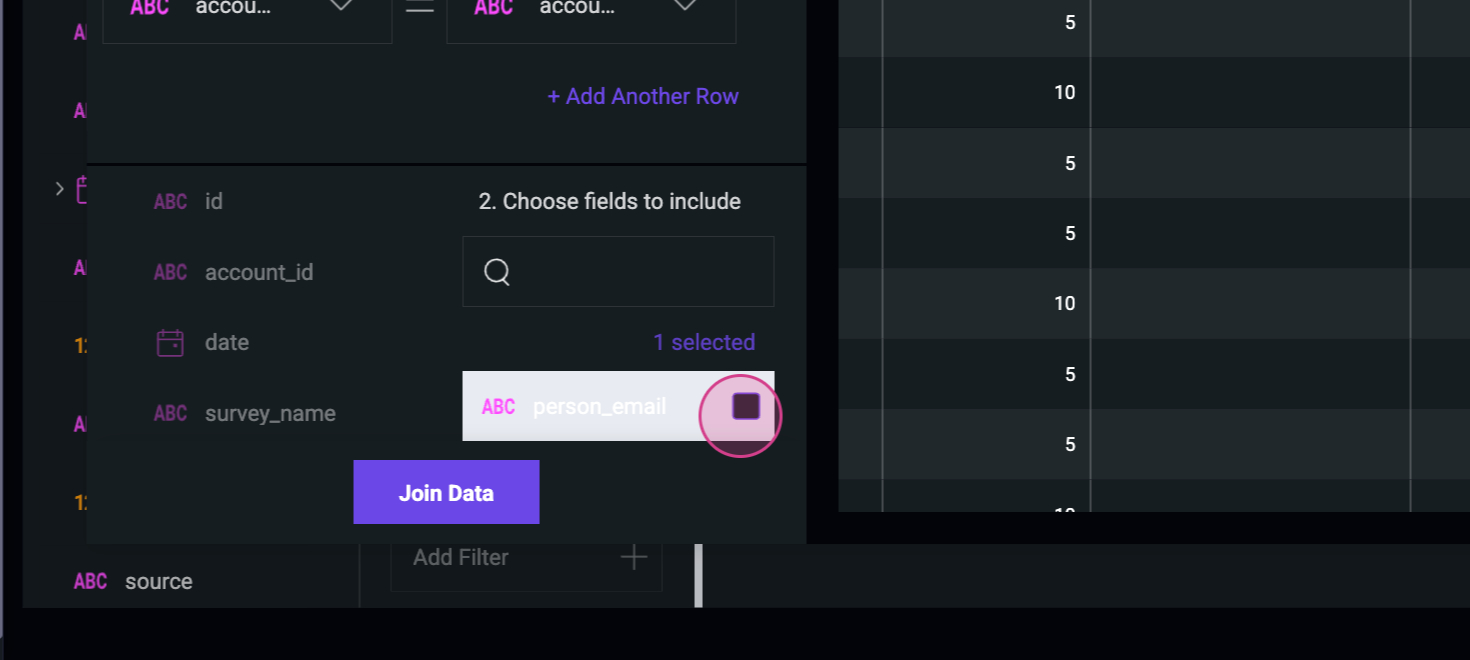
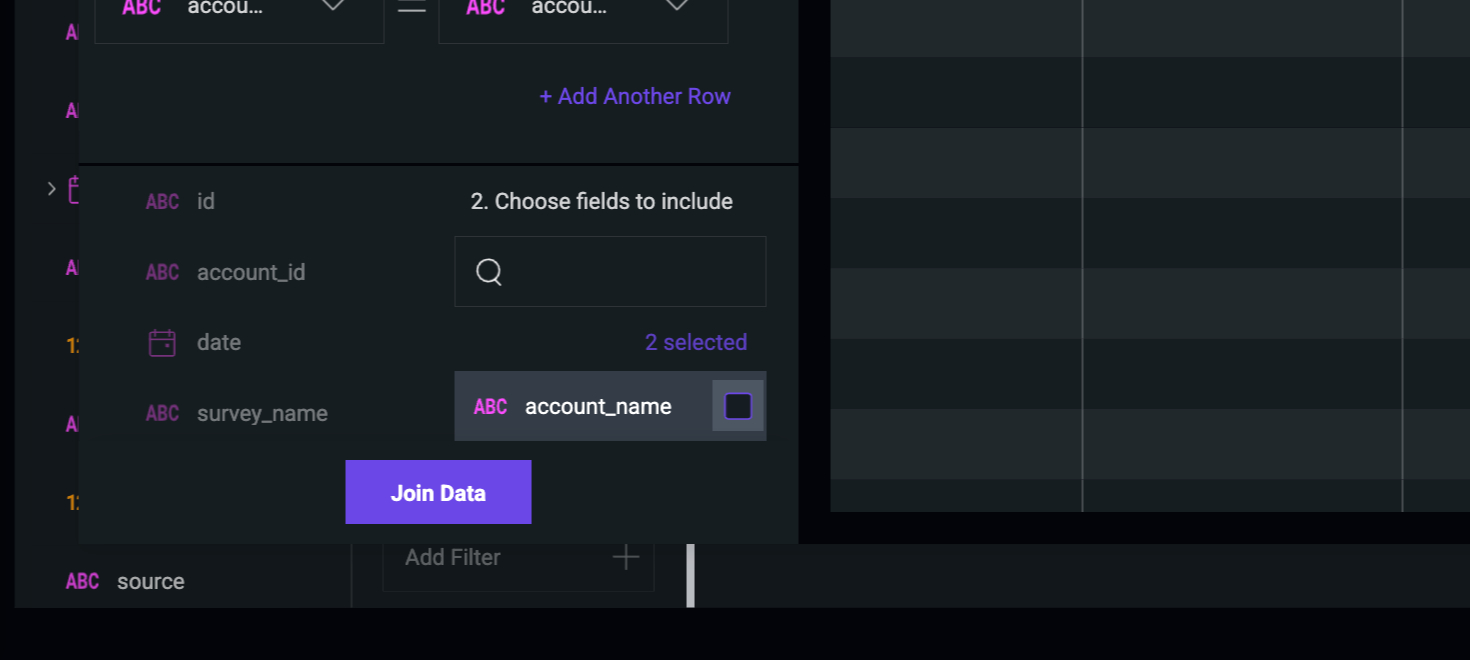
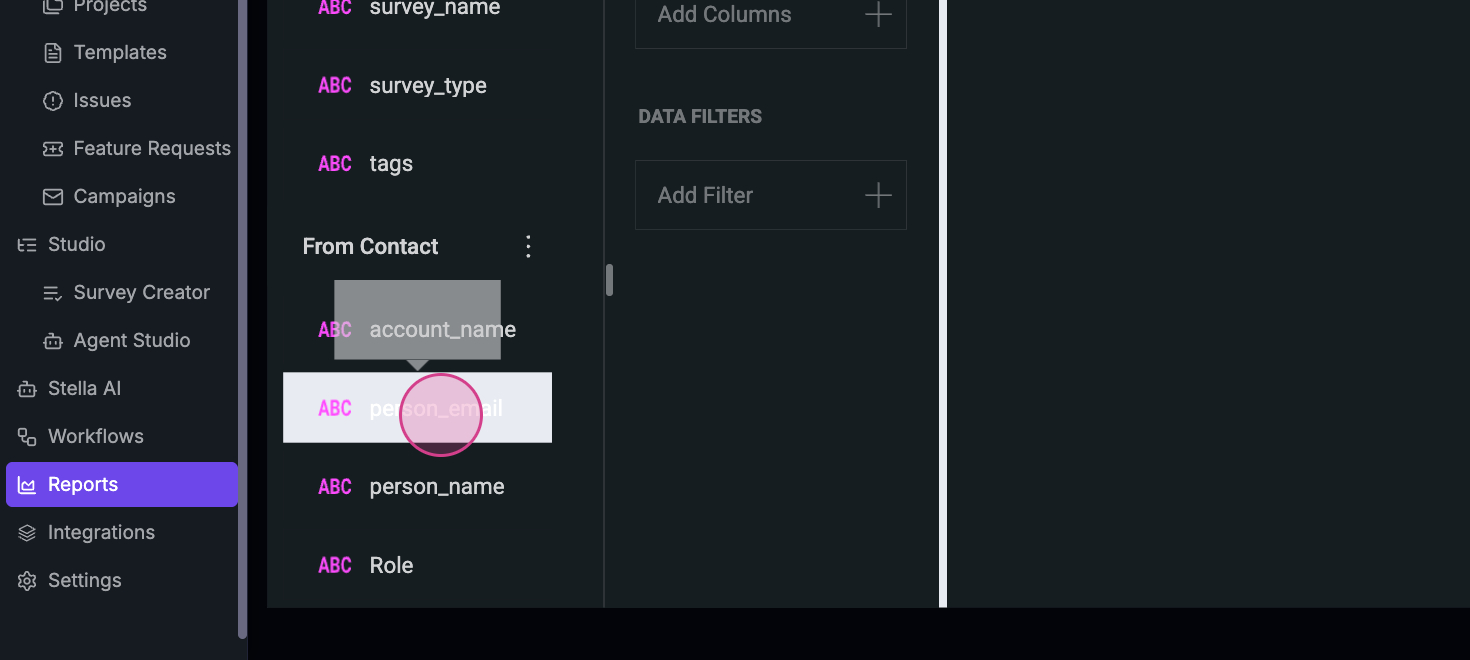
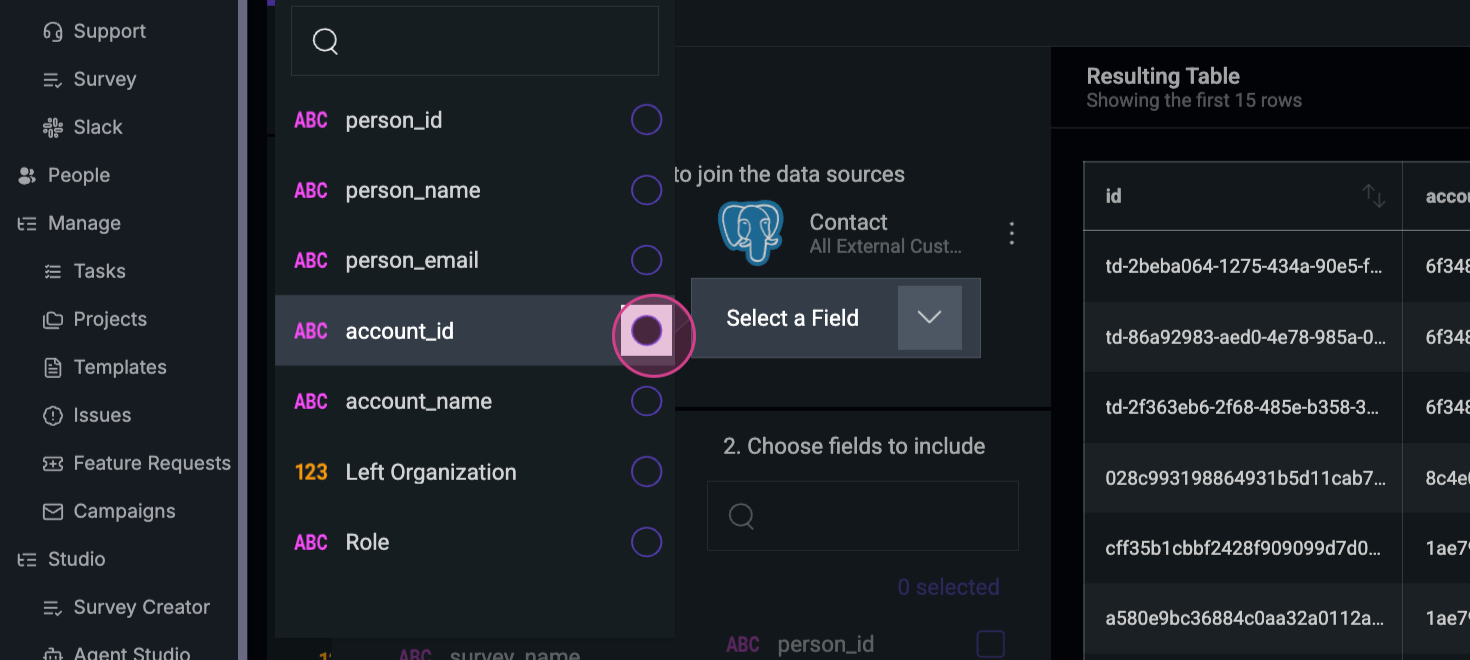 Step 6: In the contact section, select the Person name, Email ID, and Account name. If you need the role, add it here.
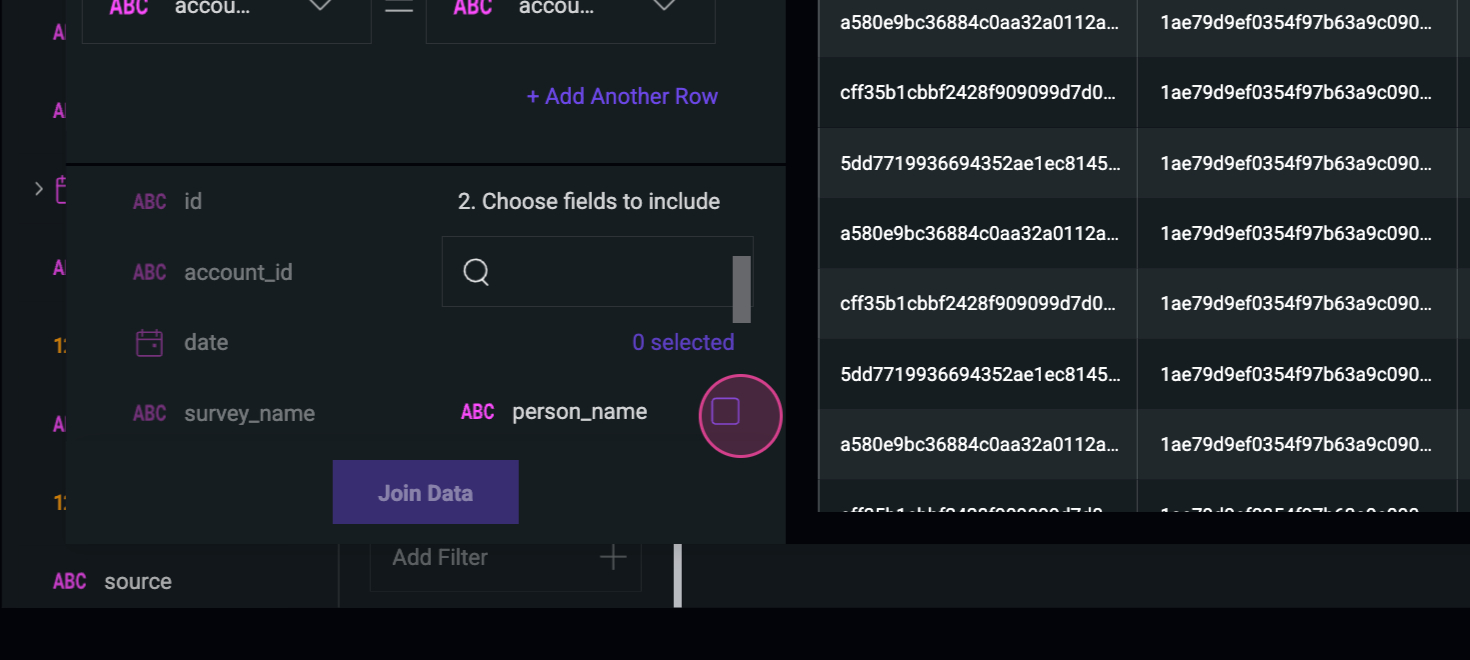
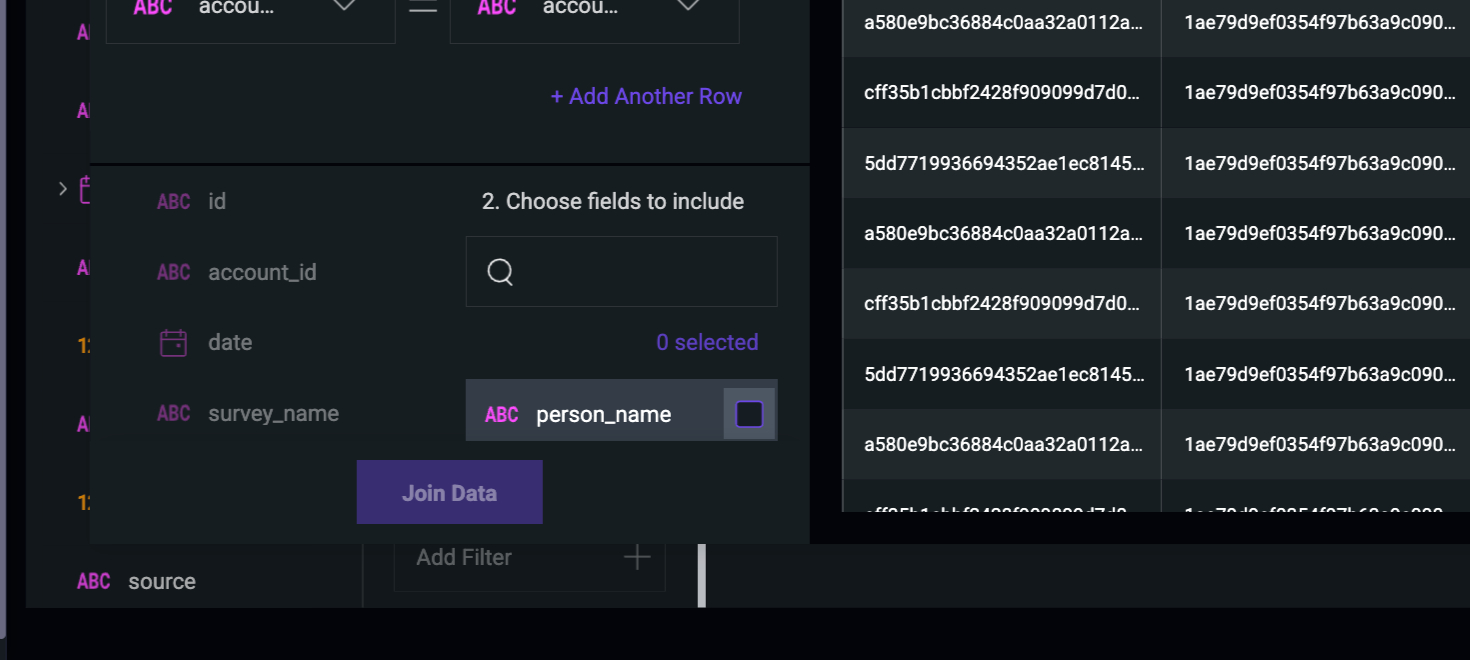
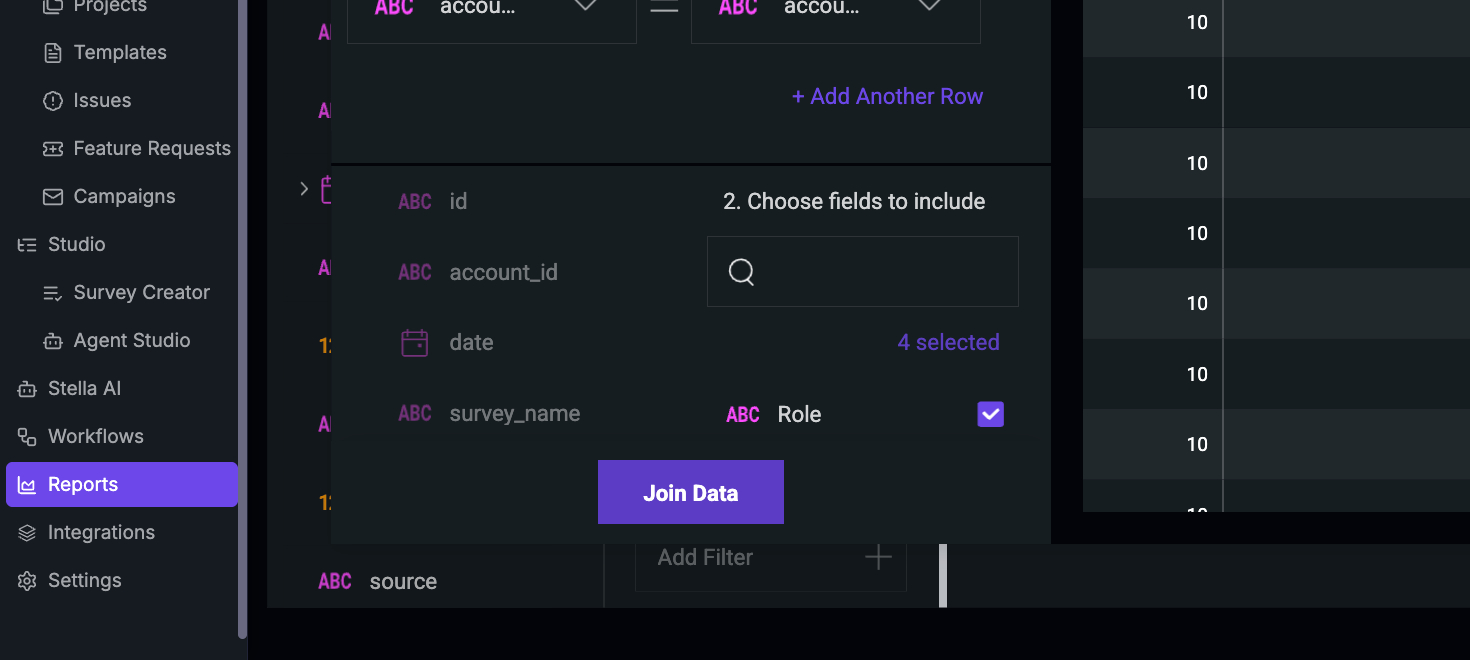
 Step 7: Click on Join Data to combine all the selected fields.
 Now, you have all the necessary fields to create the survey.
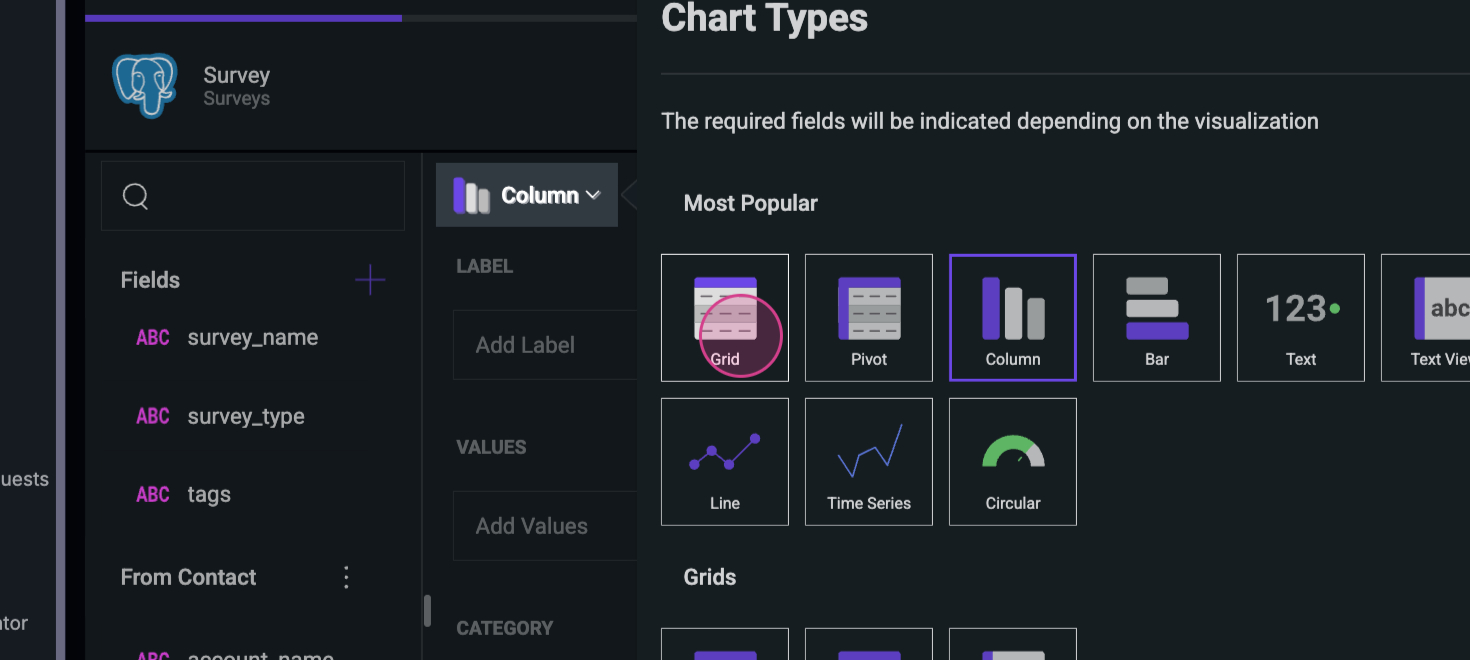
Step 8: Before creating the survey, choose the grid chart type.
Now, you have all the necessary fields to create the survey.
Step 8: Before creating the survey, choose the grid chart type.
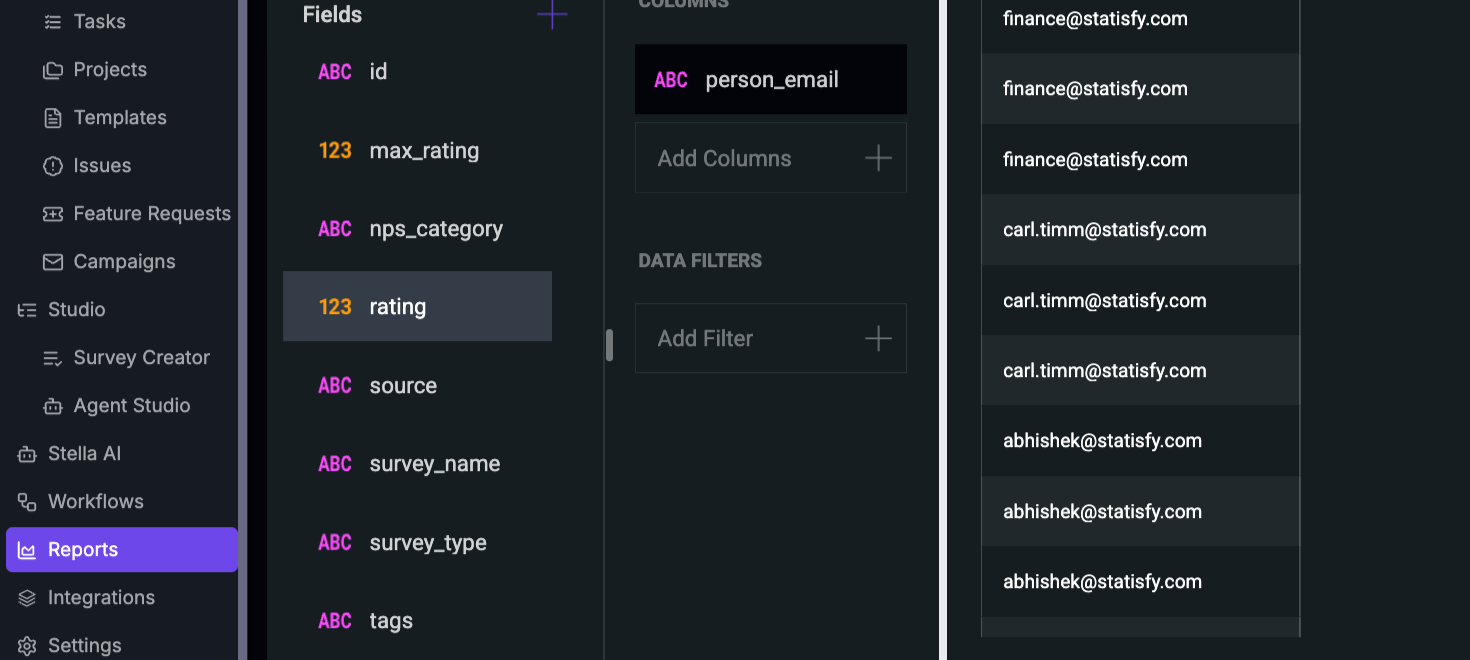
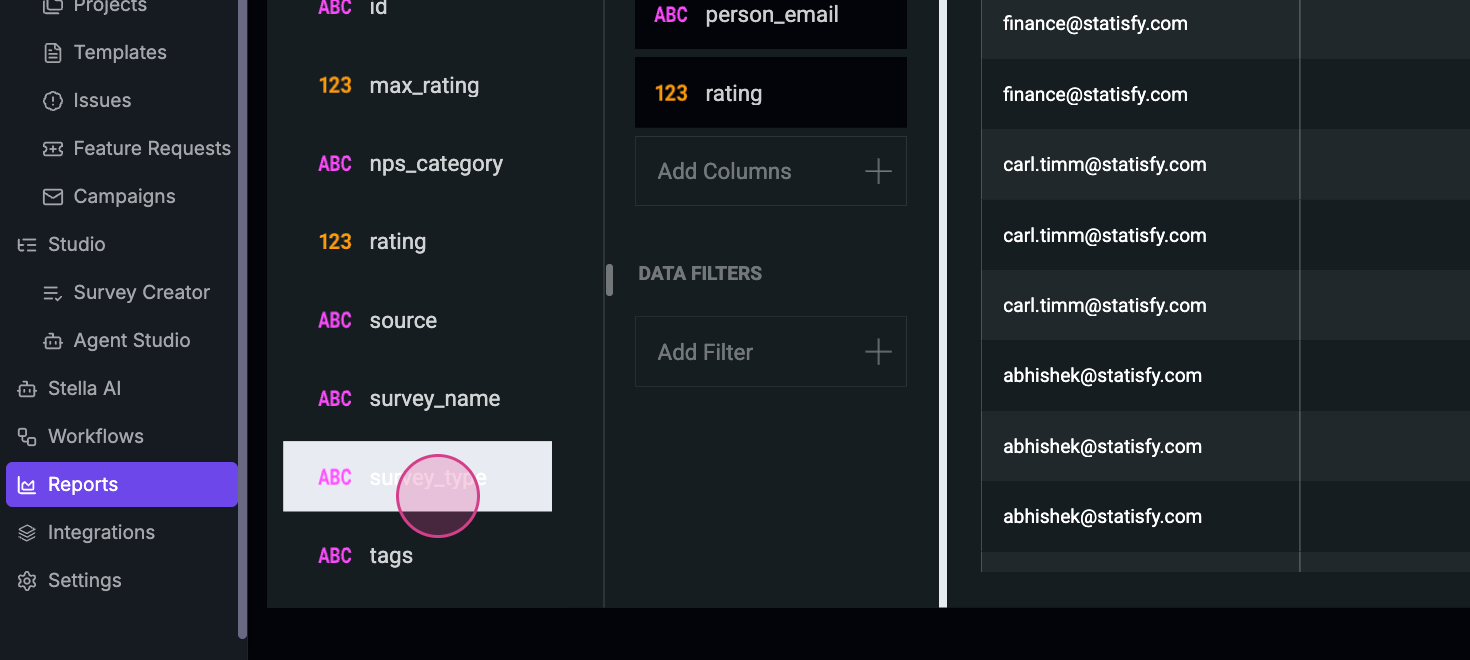
 Step 9: Select the Person’s email, Role, and Account name. Next, pull the Survey rating and Survey type.
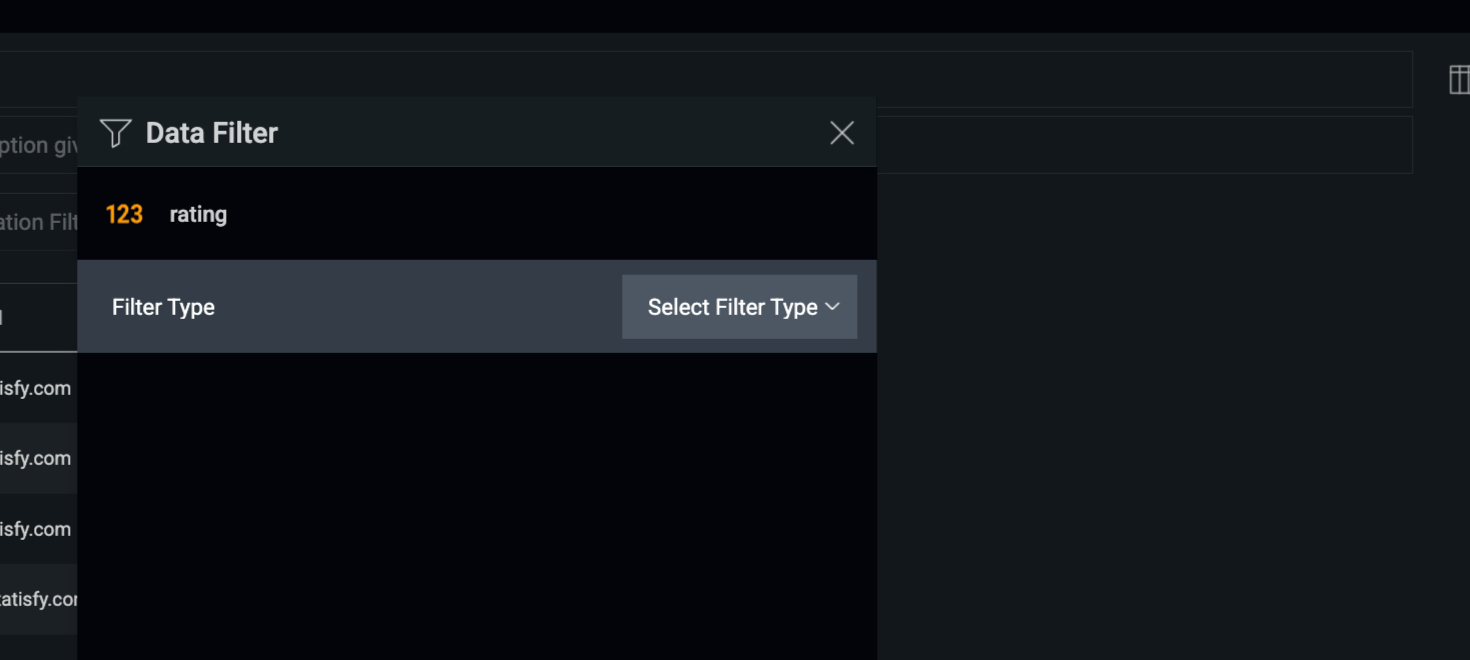
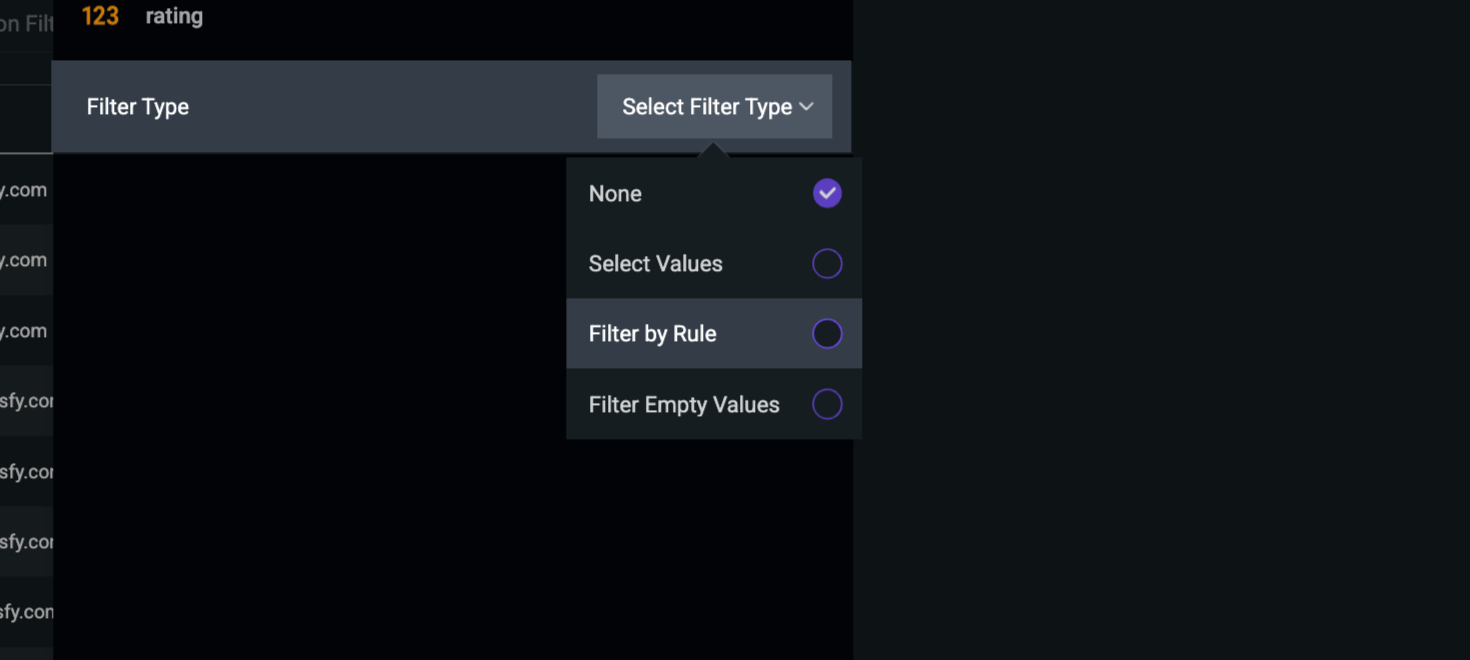
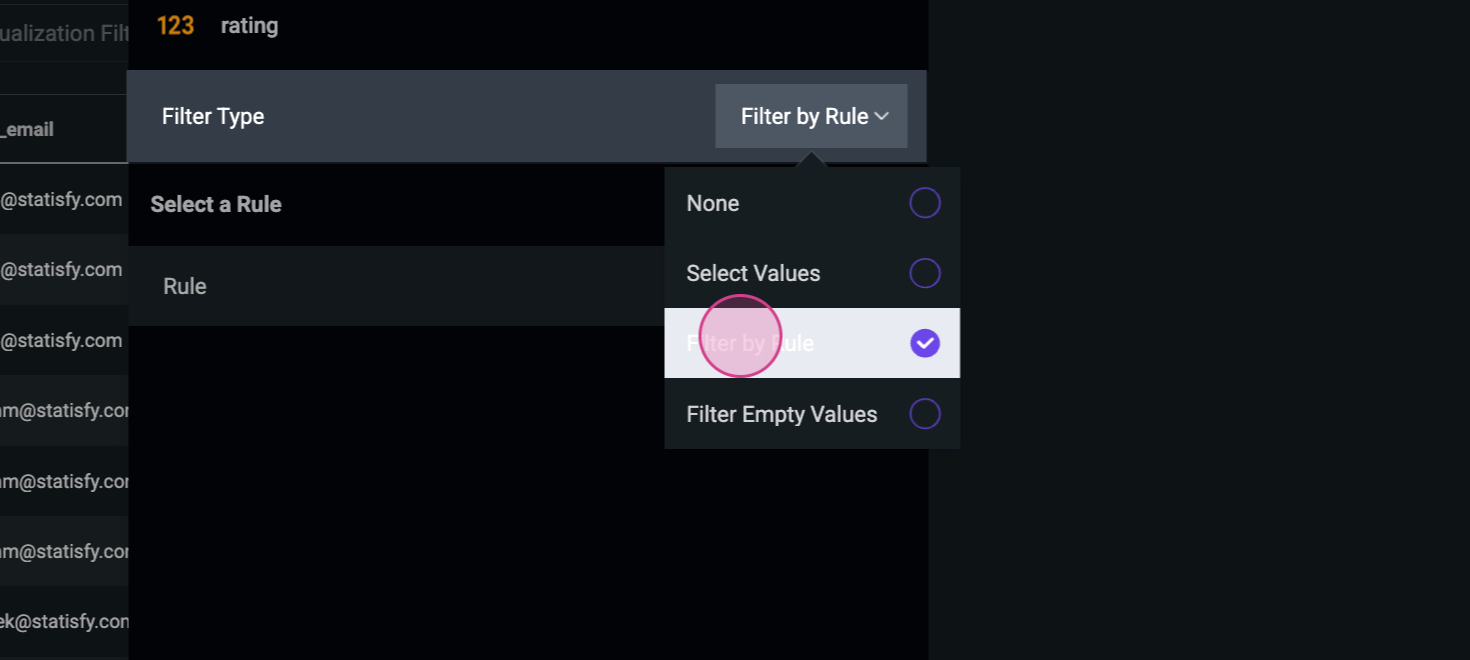
 If you don’t want all surveys to be displayed, you can filter them.
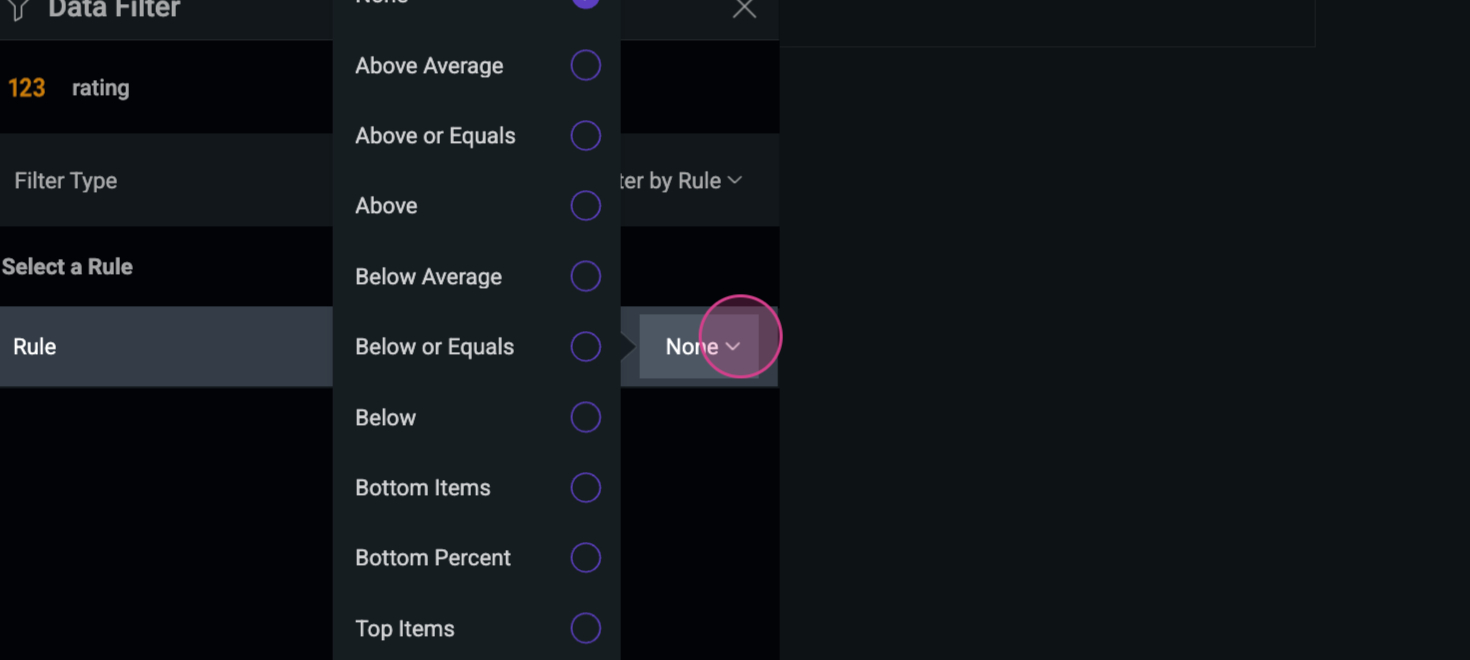
Step 10: Click on Filter by Rule.
If you don’t want all surveys to be displayed, you can filter them.
Step 10: Click on Filter by Rule.
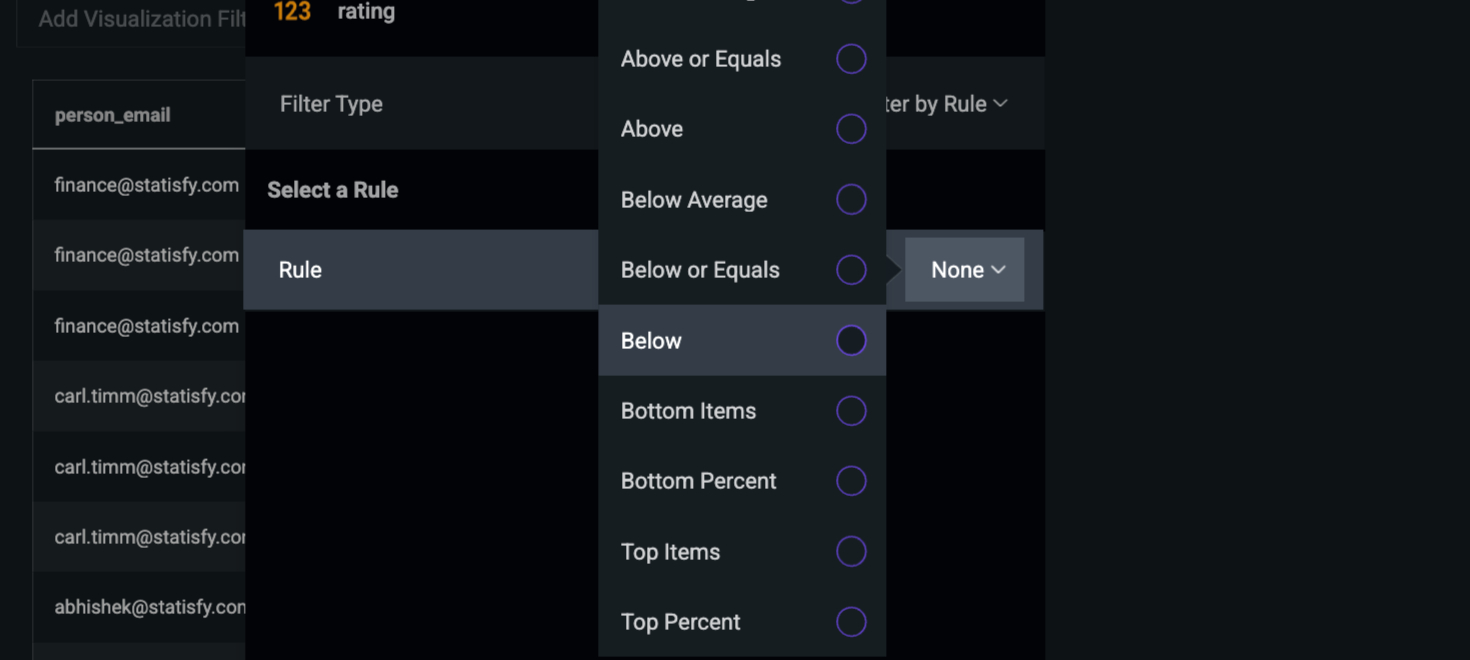
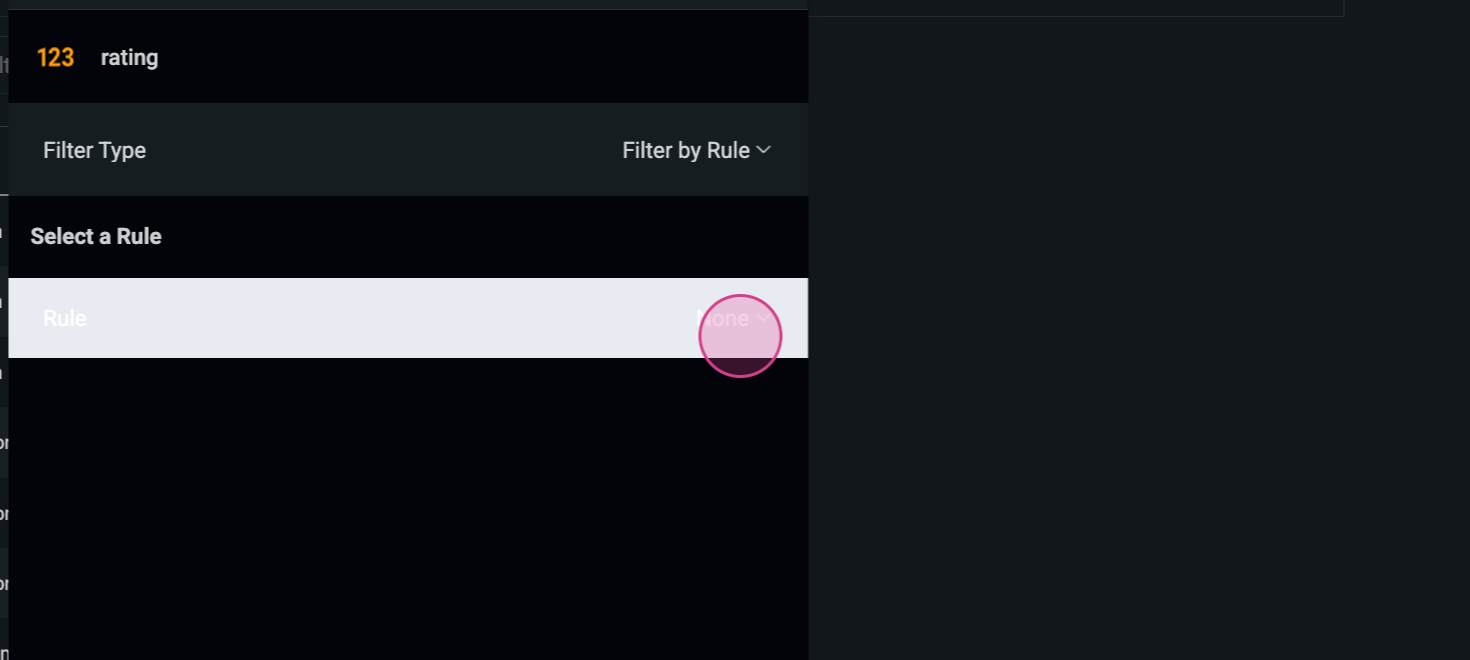 Step 11: Set the rule to display only ratings below 5.

 Step 12: Choose the number 5 to filter out ratings of 6 and above.
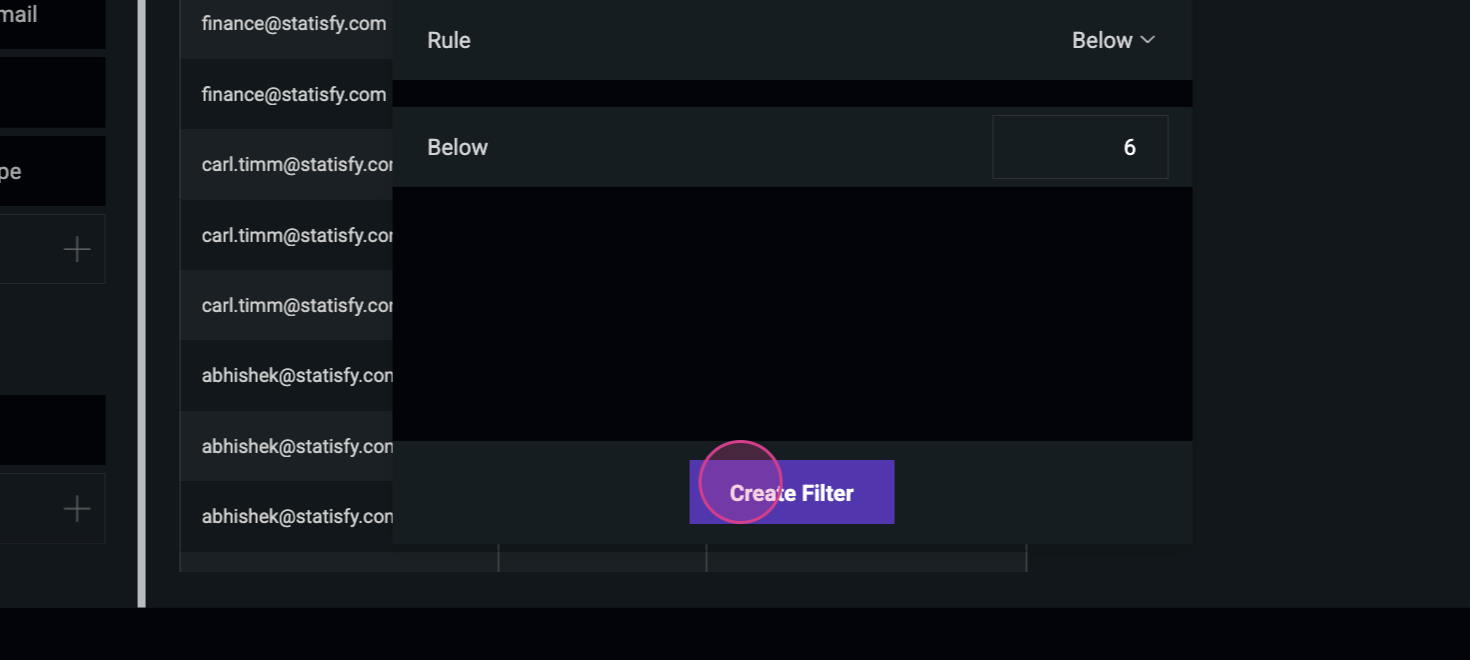 Now, only ratings below 5 will be displayed. And that’s how you create a survey report. Thank you for reading!